Data Science and Drought
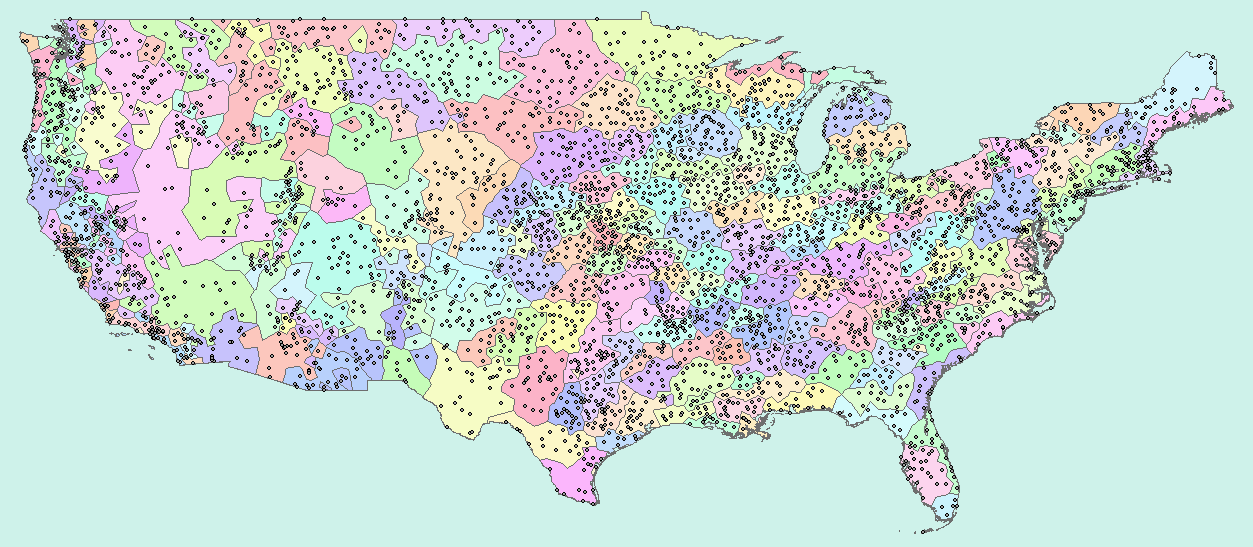
My work at the National Drought Mitigation Center, part of the University of Nebraska-Lincoln, included writing a computer program that clusters roughly 4000 drought stations in the continental United States for use in an upcoming update to their Drought Risk Atlas. The main data one wants to use for this is precipitation, latitude, and longitude, although also using temperature and elevation can be useful, and one can also use drought indices such as SPI, SPEI, and PDSI. In fact, one feature of the program is that it can use oscillatory data for each station based on oceanic and atmospheric indices such as Niño-indices ONI, SOI, and MEI to help cluster the stations.
The main motivation for the program, besides using many different features such as drought indices and oceanic/atmospheric information, is that modern data analysis techniques and computer speed allow for the computer program to automate many of the subjective decisions involved in clustering that were handled manually before by experts (see [G], [HW]), such as moving discordant stations and using topological techniques to deal with disconnected or highly spread-out clusters. It also uses updated methods for checking the homogeneity of a cluster, using conclusions of a comparative study of homogeneity tests [VLC]. Finally, since some of these operations are sensitive to initial conditions, creating different sets of clusters even after using the same parameters, the program creates a final set of clusters based on a probabilistic perspective: two stations should be in the same cluster only if the clustering program puts them together, say, 80% of the time (a user-defined percentage).
References:
- [G] Nathaniel B. Guttman, "The use of L-moments in the determination of regional precipitation climates", J. Clim. 6 (1993) 2309-2325.
- [HW] Jonathan R. M. Hosking and James R. Wallis, Regional Frequency Analysis: An Approach Based on L-Moments, Cambridge University Press, 1997.
- [VLC] A. Viglione, F. Laio, and P. Claps, "A comparison of homogeneity tests for regional frequency analysis", Water Resour. Res. 43 (2007) W03428.