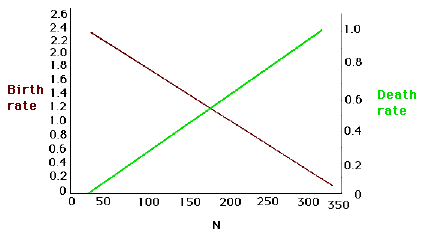
yes -- compare the b value for an individual in a population with N = 100
with b for an individual in a population with N = 500. If it's different,
then b depends on density. The same for d ... in this example, both b
values and d values change between small and large populations.
Remember, b and d are the birth and death rates per individual.
Click here to get to question 3.