SPSS On-Line Training Workshop

SPSS On-Line Training Workshop |
|
|
 In this Tutorial: |
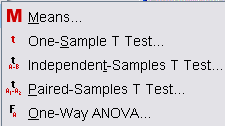
The following movie clips are used to demonstrate t-tests and one-way ANOVA:
|
In this on-line workshop, you will find many movie clips. Each movie clip will demonstrate some specific usage of SPSS.
Means: This procedure computes summary statistics for dependent variables within the levels of one or more independent variables. It has one submenu.
|
Options- This allows you to request for ANOVA table and test for linearity. |
One-Sample t-test: Tests whether the mean of a single variable differs from a specified constant. The assumptions include the population follows normal distribution.
Independent Sample t-test: Helps you to compare the means for two groups. The assumption is each population follows a normal distribution. The variances of two populations may be constant. If this is the case, pooled variance can be used, in order to have a better estimate of the common variance. Otherwise, non-constant variance t-test is more appropriate. The assumption of normality can be checked using Q-Q plot. The assumption of constant variance requires a separate F-test for comparing variances.
Paired Sample t-test: Compares the means of a variable observed at two different situations of a single group. The two situations are often two different times (Before and After a certain treatment). For example, a researcher may be interested in the effect of weight loss of a weight control program. Individuals in the experiment will be measured for various responses such as weight before and after taking the weight control program training. Two weights are measured from the same experimental unit BEFORE and AFTER the treatment. The effect of the weight loss can be examined using Paired t-test.
Each of the t-test procedures has one submenu.
Options- This allows users to change the Confidence Interval from the default value of 95%. Options also let you determine how you will handle missing values. |
![]() Click
here to watch T-Test Procedures
Click
here to watch T-Test Procedures
The data used for this movie clip is the Cancer data set. See the Data Set page for details.
One-Way ANOVA: Analysis of variance for a quantitative dependent variable of a single factor. This is an extension of independent t-test when the number of levels of the factor is more than two. Typical assumptions are normality and constant variance for each level. The normality assumption can be checked using Q-Q plot or some normality test statistics. The constant variance can also be examined by using 'Homogeneity of Variance Tests' such as Levene's test in SPSS. The submenus are:
Contrasts- This allows you to partition the between-groups sum of squares into trend components (polynomial). Alternatively, one can specify contrasts, which are determined prior to the data collection.. | |
Post Hoc- Here you can choose a test and use it to determine which means differ. Tukey is generally used if you have a large number of comparisons. For a small number of comparisons, Bonferroni can also be used. | |
Options- You can get descriptive statistics for each level of factor variable and test for homogeneity of variance. |
![]() Click
here to watch One-Way ANOVA
Click
here to watch One-Way ANOVA
The data used for this movie clip is the
Food Company data set.
See the Data Set page for details
![]()
![]()
This online SPSS Training Workshop is developed by Dr Carl Lee, Dr Felix Famoye , student assistants Barbara Shelden and Albert Brown , Department of Mathematics, Central Michigan University. All rights reserved.