The Mole fraction, xj , is the amount
of J expressed as a fraction of the total amount of molecules, n, in the
sample.
xJ = nJ / n where n = nA + nB + .....
It follows that xA + xB + .... = 1
We define Partial Pressure pJ , of a gas J in a
mixture ( perfect or real) as pJ = xJp , where p is
total pressure.
Also pA + pB + ..... = (xA + xB + .... ) p = p
Example 1:
The pressure of a gaseous mixture of NH3 and N2 decreased from
1.5 kPa to 1 kPa after all the NH3 was absorbed from the
mixture. Assume ideal gas behavior and
find initial composition of the mixture.
Partial pressure of N2 is 1 kPa , PT = PNH + PN
P(NH3) = PT - P(N2) = 1.5 kPa - 1
kPa = 0.5 kPa
from Dalton’s Law : x(N2) = P(N2)/PT = 1 kPa/1.5kPa =
0.67
x(NH3) = 1- x(N2) = 0.33
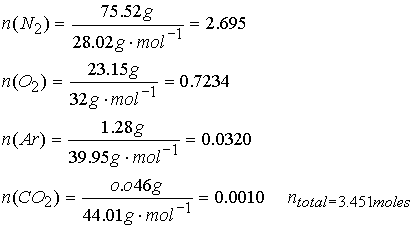
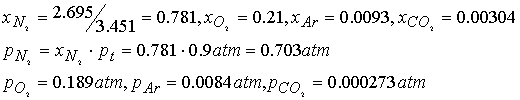
Example 2:
The mass composition of dry air at sea level (in g%) is (N2): 75.52, (O2): 23.15, (Ar):
1.28, (CO2): 0.046. What are
the partial pressures at 0.90 atm total p?
The ideal gas law is derived using the ideas from the kinetic
model of gases.
Assumptions:
1.
gas molecules are in ceaseless random motion
2.
molecular size is negligible (molecular diameter << average
collision distance)
3.
molecules do not interact; elastic collisions (like billiard
balls)
Given this picture of gas molecules one can derive expressions for
the average speed of molecules as a function of pressure, temperature and
volume.
The (ideal) perfect gas law then best predicts the behavior of a
gas at low pressure and moderate temperature.
The low pressure keeps molecules away from each other and the moderate
temperature keeps their kinetic energy too high to stick to each other when
they do collide.
Real Gases
Real gases deviate from ideal gas law equation because molecules interact with each other.
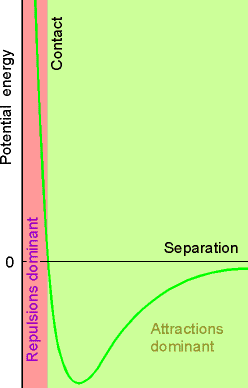
Fig. 1.21
•repulsive forces significant at short range (high pressure,
close)
• attractive
intermolecular forces ( relatively long range ),
important when molecules are fairly close together. Also when temp is very low, slow molecule speeds allow attractive forces to be more dominant.
Characterizing Real Gases
The distance dependence of the intermolecular forces can be
characterized by plotting the compression factor, Z, against pressure,
where Z is defined as
![]()
For a perfect gas Z = 1 under all conditions, deviation of Z from
1 is a measure of departure from perfect behavior.
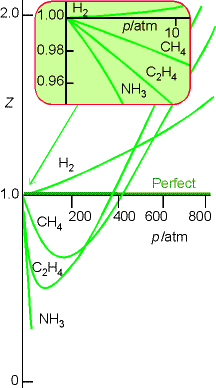
Fig. 1.22
Many equations have been developed to do a better job of
predicting the P,V,T behavior of real samples of gases. We will discuss a few. They all work well in certain conditions.
Virial Coefficients
At large molar volumes & High T’s real isotherms do not differ
greatly from ideal gas isotherms.
Suggested form for real gas:
![]()
An example of a
simple law treated with the first term in a series in powers of a variable (p).
A more convenient expansion/form:
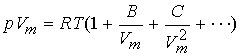
The coefficients B & C, virial coefficients, are
experimentally derived and depend on T.
C less important than B at typical molar volumes.
![]()
Compare the virial equation with the definition of the compression
factor, Z.
![]()
![]()
As P goes to 0, for a real gas, the value for dZ/dp = 0 for a
perfect gas, but for some real gases
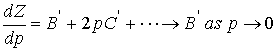
the slope of Z may not approach 0 because , B’ ¹ 0
Similarly,
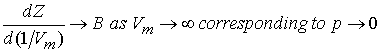
Since virial coefficients depend on T, there may be a T for which
Z = 1 with zero slope @ low p or high Vm. At this temperature, TB (Boyle
Temperature), the properties of the real gas coincide with those of the perfect
gas as p tends to 0. Z has zero slope
as p ® 0 if B = 0 at the Boyle temperature.
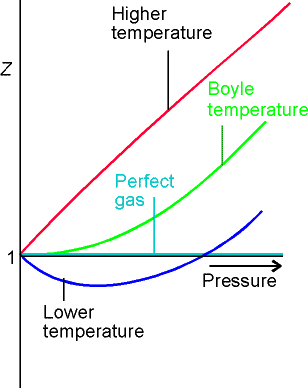 Fig. 1.24
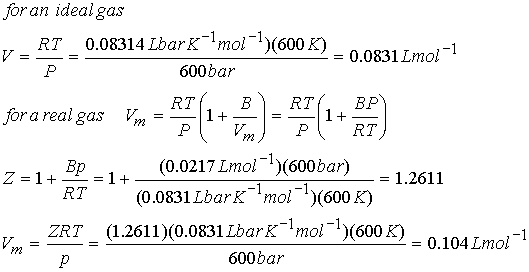
Example: What is the Vm of N2 at 600 K and 600
bar?
a.) according to ideal gas, and b.) virial equation
B(N2) @ 600K =
0.0217 L mol-1
Condensation:
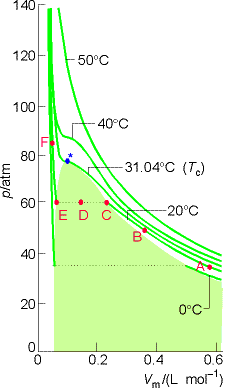
The pressure at
the two phase region (EDC) is called the Vapor pressure of the liquid at
the temperature of the experiment. The * @ Tc (31.04 0C
for CO2) is a special temperature in the theory of matter. At less than Tc , the isotherm
shows the two phase liq/gas equilibrium region.
At T = TC, phase separation does not occur and the volumes of each end of the isotherm merge to a single point, the critical point of the gas. The p, T, and V at the critical point are called the critical temperature, Tc , the critical pressure, pc, and the critical molar volume, Vc.
At and > Tc, the fluid occupies the entire volume of the
container. The liquid phase will not
form above Tc, and the gas phase is at this region is called a supercritical
fluid. It is denser than a normal
gas but not considered a liquid.
Supercritical CO2 is used as a solvent for extraction and
chromatography.
The van der Waals equation
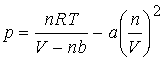
J. H. van der Waals 1873
The constants a
& b are called the van der Waals coefficients. a & b are not a function of T.
Excellent example of physical model/equation derivation.
1.
When repulsion's are significant, small impenetrable spheres that
take up space suggest actual volume is V - nb.
(Volume of the molecules is no longer negligible.)
2.
Pressure depends on both frequency and speed of collisions. These are reduced by attractive forces that
act proportional to molar conc. (mol/L), n/V.
Since frequency and force are reduced by the attractive forces,
the pressure is reduced in proportion to the square of the concentration, - a
(n/V)2.
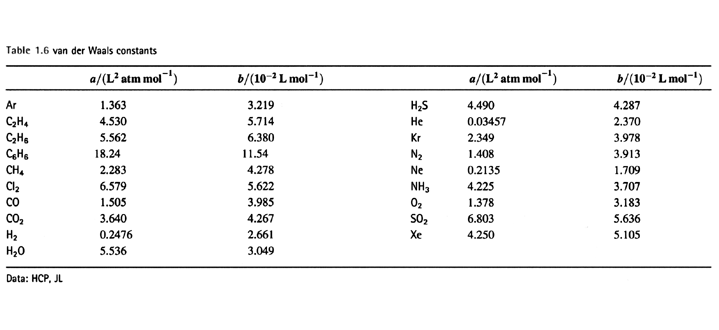
What is the molar volume of water @ 1.01325 bar and 100.0 °C.? Use van der Waals equation.
![]()
a = 5536 L2 atm mol-2, and b = 0.03049 L mol-1
note cubic equation with 3 roots!
Use
excel solver. Vm = 30.49 L/mol
The reliability of the van der Waal equation
Optimistic for one equation to describe many real gases. (however, it is an analytical expression)
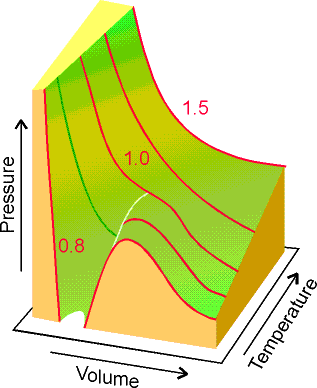
Figure 1.23 Figure
1.25
Real data on CO2 van
der Waal equation
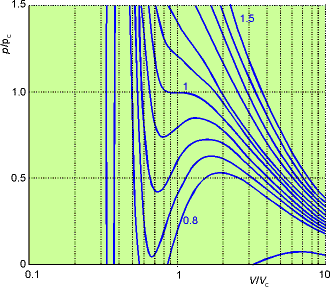
Figure 1.26
Apart from the oscillations below the critical point, they do
resemble experimental isotherms quite well. The red
line is a tie line where both liquid and gas exist.