Wave Action Laboratory Exercise
ESC 210
The following landforms are from
|
Shore Forms
Shore Forms: A Gallery
|
|||||||||||||||||||||||||||||||||||||||||||||||||||||
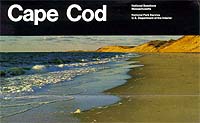
Cape Cod
National Seashore
|
|
|
|
|
|
|
|
|
|
|
|

![]()
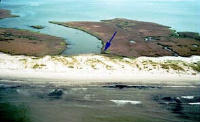
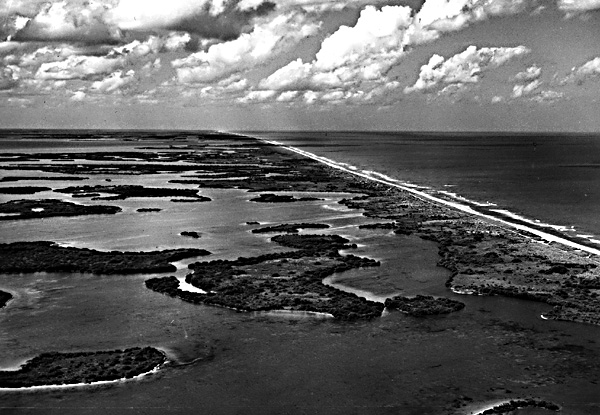
Cape Cod resembles a flexed arm of sand thrust out into the
About 15,300 years ago, a huge ice sheet, which flowed
southward from
When the ice sheet disappeared, the landforms of the
Landscapes change quickly in
The encroachment of the sea following deglaciation
permitted wave currents to erode and rework the glacial drift. As waves
refracted, energy was focused on the headlands. Consequently, peaks of land
were worn down by wave erosion, creating a system of steep, wave-cut cliffs.
The sediment moved by nearshore currents sequentially formed a series of sand
spits and barrier islands (Uchupi et al., 1996). Prior to 6,000 years ago, the
longshore drift of sand was predominantly to the south. This prevailing pattern
of sediment movement formed the southern barrier island system of Nauset Spit,
and eventually,
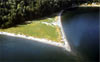
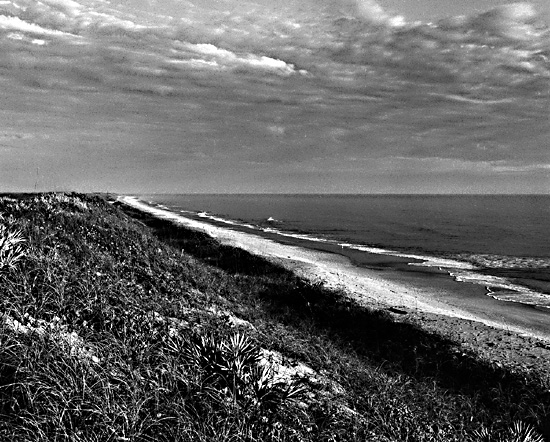
Erosion of the glacial deposits produced imposing marine
cliffs, many of which are currently retreating at alarming rates. Although
scarp retreat of the eastern shoreline averages 0.67 m/yr, specific coastal
sites are losing land to the sea at higher rates. For example, the cliffs below
Wellfleet-by-the-Sea are retreating approximately 1.0 m/yr (Pinet, 1992).
Because most of this erosion occurs during storm events, cliff retreat is not
constant over time.
A summary of
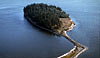
Active coastal dunes are dynamic landforms whose shape and
location are ever-changing. Youthful, unvegetated dunes are on the move as the
sand, exposed to the prevailing wind, is picked up, transported, and
redeposited repeatedly. When the dunes become vegetated, they stabilize and
tend to remain unchanged for a time. If the dunes lose the protective
vegetation, they will move again. This can be seen along US Route 6 in
1.
Cape Cod Topographic Map: 1:250,000 app. 4
miles per inch B & W copy and Provincetown 1:24,000 topographic map.
1. To what does
2.
What have waves and nearshore currents done to the glacial deposits? Reshaped them into sandy beaches, towering sea cliffs and
bluffs, a discontinuous chains of barrier islands, and elegantly curved sand
spits.
3.
How prominent are man-made shoreline protection structures? Not prominent, very few.
4.
Where can you find the terminal moraine from the Cape Cod Bay Lobe? South of Cape Cod in Nantucket Island and Martha's Vineyard.
5.
What types of glacial materials resulted from the Cape Cod Bay Lobe? Till, Lacustrine, Outwash
6.
a. What glacial feature represents the major geologic feature of the lower
b. How common are kettle lakes and ponds on
the southern arm of
7.
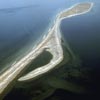
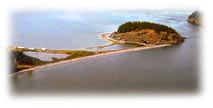
What features did a predominantly southerly longshore drift produce? Nauset Spit, (beach) and
8.
a. What happened when
b. What did the northerly transport of sand accomplish? Formed the curved spit system that surrounds Provincetown.
9.
a. What direction of current movement is indicated by Long Point? (More easily
seen on
b. What direction of current (littoral)
movement is indicated by
10.
a. Which type of dune is found on the
b. What is the shape of this type of
dune? U shaped, Horseshoe shaped
c. What wind direction is most
responsible for the orientation of the dunes? Northwest
d. What causes the dunes to stabilize or
migrate (move)? Establishment of vegetation will
stabilize the dune and destruction of the vegetation will cause the dune to
migrate.
Read the
following section on Barrier Islands as this is what you will be seeing at Cape
Hatteras, N.C. and Cape Canaveral, FL
What are
|
|
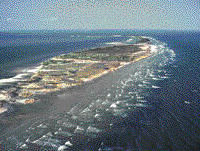
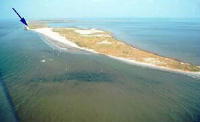
Barrier islands
are long, narrow, offshore deposits of sand or sediments that parallel the
coast line. Some barrier islands can extend for 100 miles (160 km) or more. The
islands are separated from the main land by a shallow sound, bay
or lagoon. Barrier islands are often found in chains along the coast
line and are separated from each other by narrow tidal inlets, such as
the Outer Banks of NC.
The formation of barrier islands is complex and not completely understood. The current theory is that barrier islands were formed about 18,000 years ago when the last Ice Age ended. As the glaciers melted and receded, the sea levels began to rise, and flooded areas behind the beach ridges at that time. The rising waters carried sediments from those beach ridges and deposited them along shallow areas just off the new coast lines. Waves and currents continued to bring in sediments that built up, forming the barrier islands. In addition, rivers washed sediments from the mainland that settled behind the islands and helped build them up.
|
|
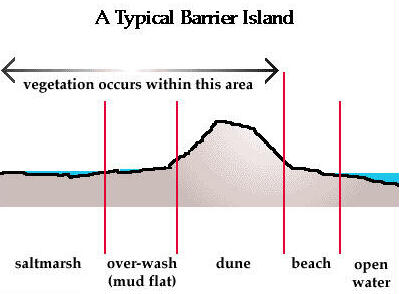
The structure of a
typical barrier island consists of the following zones from the ocean side
toward the sound:
- Beach - consists of sand deposited
by the actions of waves
- Dunes - formed from sand carried and
deposited by winds. Dunes are stabilized naturally by plants (sea oats, bitter
pancum) and artificially by fences. The primary dune faces the ocean and
may be followed by secondary and tertiary dunes inland.
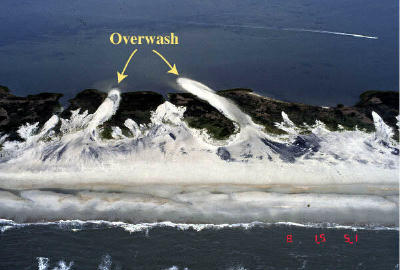
- Barrier flat - (also called backdune,
overwash or mud flat) formed by sediments that get pushed through the dune
system by storms, such as hurricanes. Grasses grow and stabilize these
areas.
|
|
- Salt marsh - a low-lying area on the
sound-side of a barrier island. Salt marshes are generally divided into
high and low marsh areas. High marsh areas get flooded twice each month
with the spring tides, while low marsh areas get flooded twice daily with
the high tides. Cord grasses stabilize the salt marsh area, which are one
of the most ecologically productive areas (amount of vegetation per acre)
on Earth.
Barrier
islands serve two main functions. First, they protect the coastlines from
severe storm damage. Second, they harbor several habitats that are
refuges for wildlife. In fact , the salt marsh ecosystems of the islands
and the coast help to purify runoffs from mainland streams and rivers.
Each of these habitats has distinct animal and plant life, which we will
discuss in the next section.
The Shifting Sands
Barrier islands are constantly changing. They are influenced
by the following conditions:
- Waves - deposit and remove sediments from the ocean side of the island
- Currents - longshore currents that are caused
by waves hitting the island at an angle can move the sand from one end of
the island to another. For example, the offshore currents along the east
coast of the
- Tides - move sediments into the salt
marshes and eventually fill them in. Thus, the sound sides of barrier
islands tend to build up as the ocean sides erode.
- Winds - blow sediments from the
beaches to help form dunes and into the marshes, which contributes to
their build-up.
- Sea level changes - rising sea levels tend to
push barrier islands toward the mainland
- Storms - storms have the most
dramatic effects on barrier islands by creating overwash areas and eroding
beaches as well as other portions of barrier islands.
|
|
The impacts of storms on
barrier islands depend upon qualities of the storm (storm surge, waves) and upon the elevation of the barrier island at landfall.
To quantify the impact of storm damage, the U.S. Geological Survey (USGS) has
devised a "hazard scale" as follows:
- Impact 1 - Wave erosion is confined to
beach area. The eroded sands will be replenished in a few weeks to months and
no significant change occurs in the system.
- Impact 2 - Waves erode the dune and
cause the dune to retreat. This is a semi-permanent or permanent change to
the system.
- Impact 3 - Wave action exceeds the
dune's elevation, destroys the dune and pushes sediment from the dune
landward (approximately 300 yards/100 m), thereby creating overwash. This
change in the system pushes the barrier island landward.
- Impact 4 - The storm surge completely
covers the barrier island, destroys the dune system and pushes sediments
landward (approximately 0.6 miles/1 km). This is a permanent change to the
barrier island or portions of it.
|
|
2. Cape Hatteras
Examine
the Raisz map and note the string of offshore islands from the south shore of Long Island Atlantic
and Gulf coasts. They are particularly dangerous places when hurricanes sweep
the coastlines. Find Capt Hatteras, N. C. on the Raisz diagram and the
topographic maps.
1.
Geomorphic Province: Coastal Plain
2.
a. What is the geomorphic name for Cape
Hatteras
b. 1. Is Cape Hatter
2.
Explain your answer to b1. (Cape
Hatteras is being extended into the Atlantic Ocean )
c. What is the geomorphic name for Hatteras Island ? (barrier island)
The barrier islands off North
Carolina
d. Note how the 30 and 60
foot bathymetric lines (underwater contours) outline the full dimensions of the
islands and cape.
e. 1. What is the width of the surface
expression of Cape
Hatteras
2. What
is the width of the surface and sub-surface expression of Cape Hatteras
e. 1. Cape
Hatteras is being built out into the Atlantic Ocean . Note the shape of the point of the cape
on the two topographic maps. The B & W map was made from 1972 aerial
photographs and the 1:24,000 map was made from 1946 aerial photographs. What
difference in the shape of the cape do you see between the two maps? (Very smooth symmetrical point on the 1:24,000 map and a
projection to the south on the 1:250,000 topographic map. )
2. What would the symmetrical shape in 1946
suggest about the balance between currents moving from the north and from the
south along the shoreline? (That the current movements
would have been balanced and thereby produced the symmetrical point.)
3. What does the extended point on the
1:250,000 map suggest in terms of a balance between currents that move from the
north and the south along this shoreline? (There does
not seem to be a balance between the currents from the north and the south and
the current from the north appears to be stronger than the current from the
south between 1946 and 1972 because the extension of the point in a southerly
direction is prevailing over currents that would push the point eastward.
3.
a. What is an average width of the surface expression of Hatteras
Island ? (about 1 mile to 1.5)
b. What is an average
width for the surface and sub-surface expression of Hatteras
Island ? (4-6 miles)
b. If you drove Route 12
along Hatteras Island how close would you be
to sea level most of the time? (Within 10 ft.)
4.
Assume you were at Cape Hatteras and had a medical emergency, called 911 and
EMT's left from Norfolk
5.
Why would the National Park Service personnel call for an evacuation of the
barrier islands in the event of a hurricane? (The storm
surge can easily overtop the barrier islands and remake the landscape. Some
before and after pictures of the same area after a severe hurricane have barely
recognizable points in common.)
6.
Kitty Hawk is just to the north of your B
& W map. It was isolated in 1900, but has become a famous tourist area with
many structures close to the water and in harms way when severe storms move
along the North Carolina
Once a remote
area, Kitty Hawk has grown into a summer resort area and provides some of the
best beach recreation on the
When Orville Wright stepped ashore in
From that moment forward,
Read the following about
PLATE
C-14
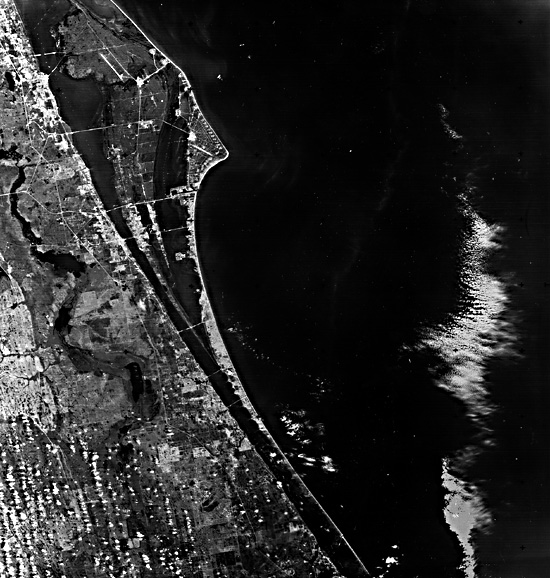
CAPE CANAVERAL , FLORIDA
|
|
|
|
Plate C-14 |
Map |
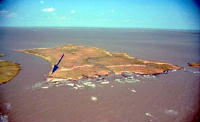
Cape Canaveral is approximately the southern limit of quartz- rich detrital
sand transported southward from rivers that drain the coastal plain, the
piedmont, and the
The oldest fossil shoreline is a series of detrital sand ridges that trend
slightly east of south through western
A second series of fossil barrier ridges can be traced between
Between the St. Johns River and Indian River, and including
Thus, as noted in Plate C-13, the modern barriers on the southeastern
3.
1.
Geomorphic Province: (Coastal Plain)
2.
a. What is the geomorphic term for
b. Note how the 30 foot bathymetric line outlines the underwater portion of the features.
c. Which of the features is the older? (
d. What map evidence did you use to answer
2b? (The barrier island to the north of Cape Canaveral
is built across the seaward projection of
e. The
shoreline currents along the east coast of
3.
a. What two government facilities are located on
b. Note the approximately 20 sites, the small circles, from which rockets can be launched. This site was chosen from which to launch rockets because it is on the east coast and the most southerly site that is suitable. A southerly location requires less engine power than a more northerly location because the coriolis effect diminishes to zero at the Equator. The easterly location also allows the lift off to take advantage of a "sling-shot" effect because the earth is rotating from west to east at approximately 915 miles per hour at this latitude.
c. The historic name for the cuspate
foreland is
d. Note the Intracoastal Waterway that runs
from north to south inland from the barrier islands,
Read the following article on Point Reyes,
CA
The Make-up of
by Jeff Scattini
Thirty five miles north of
an easier path to the top of the ridge. Walking farther,
you notice that a hole has been dug in one of these steps. You climb up about
50 feet to the first of these odd flat planes. Stepping closer and peering into
the hole, you see what you had expected—dirt—but also two things you hadn’t
expected at all: old beach sand and a geologist.
26
27
The sand is dry and brittle and has been in that hole for
the past 80,000 years. The
geologist has been in the hole since seven o’clock that
morning. Her name is Karen
Grove, Ph.D., and she is a professor at
Point Reyes coastline during a 1993 sediment survey of
Point Reyes, looking for evidence of seismic activity over the past 100,000
years. She was struck by the terraces on the flank of the peninsula. Marine
terraces are formed when the ocean cuts away at the land, explains Grove.
Slowly, over thousands of years, the ocean forms a flat plane in the landscape.
This flat plane is the beachfront where, today, people come and relax and play.
Then, perhaps every thousand years or so, an earthquake lifts the land up above
sea level. As this happens, the sea level recedes. When the sea level rises
again, it starts to cut into the land again. Since the previous ground level is
now above sea level, the ocean must start fresh. Once again, over thousands of
years, the ocean creates a flat plane in the landscape. Again, an earthquake
raises the land above the ocean’s reach, and then the ocean, again, must begin
leveling the beach. This continual leveling and raising of the beachfront
creates the terraces that form the flank of
Grove and her team took over 100 elevation Diagram of
marine terraces, which have two components–a platform carved by waves in the
surf zone, and sediments that accumulate on top of the platform. Along an
uplifting coastline, the platform and sediments get moved vertically upward
from the surf zone, so that new platforms are created at lower elevations. The
uplift rate of the coastline can be calculated by measuring the elevation of
the uplifted platform and dividing by the age when the platform was created. All
diagrams courtesy of Dr. Grove Karen Grove, Professor Department of
Geosciences
points at three different locations on the most recent
terrace. Over time, they emerged with a set of data that detailed the amount of
uplift each site on the terrace had experienced in the last 80,000 years. Grove
discovered that different areas of
shape. Once she knows the amount of uplift in a given time
frame, she can estimate the
amount of seismic activity that the area has had in the
past 80,000 years. Listening to this animated woman describe the seismic antics
of the landscape, you look out over
landscape has evolved. She pats the rocks around her,
imagining that wealth of information displayed for the public. As the sun dips
lower on the horizon, Grove says goodbye and drops down into her hole to take
the last samples of the day. You walk along the coastline and begin noticing
the tall ridge, the sandy red rocks, and the surrounding ocean in a whole new
light. Placing your hand on the bare earth, you can almost feel the intricate
interplay of the shifting fault-lines, their resulting earthquakes,
and the rising sea levels, which together have cut into and
uplift the landscape, creating terraces, and over thousands of years, formed
this remarkable bit of rock. 1 Above: Marine terraces are used to estimate the rate of
vertical uplift of the
the
28
Continue to
Plate C-15| Chapter
6 Table of Contents.| Return to Home
Page| Complete
Table of Contents|
4. Point
Reyes , CA
1.
Geomorphic Province: (Pacific Border
Province
2.
a. What kind of tectonic activity is present in this area? (Faulting)
b. Because of the tectonic
activity this coastline is very different from the East Coast and Gulf Coast San Andreas Fault )
c. On the east coast maps you saw more
evidence of shoreline deposition than erosion. At Point
Reyes there is clear evidence of shoreline erosion. Point Reyes is an example of a retrograding shoreline.
List two topographic features that indicate erosional, or retrograding
activities. (Chimney Rock, and other similar features,
and the steep south facing cliff.)
d. Go to http://stuff.mit.edu/people/dankan/
images/Point%20Reyes/images/ and view images of Point
Reyes . The lighthouse image is the Coast Guard Reservation at the
southwestern tip of Point Reyes . The rocky
cliffs are along the southern edge and the other shoreline scenes are most
likely along the western shoreline.
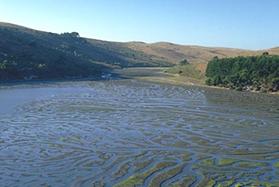
3. Drakes Estero, Point Reyes
National Seashore,
|
|
|
Tidal channels and mudflats exposed at low tide in the upper reaches of Drakes Estero, a drowned river valley. During the Pleistocene glacial epochs, worldwide sea levels were lowered as much as 425 feet. Water was removed from the oceans to form vast continental glaciers. During periods of lowered sea level, valleys were eroded and deepened in shallow offshore and coastal regions. As the glaciers melted and sea level rose again, the deeper valleys were flooded. A drowned river valley is an estuary - a coastal water body that is open to the ocean and is diluted by fresh water from the land. |
a. What drainage
pattern does Drakes Estero portray? (Dendritic)
b. How was Drakes Estero formed? (See text above.)
c. What does Limantour
Spit suggest about the prevailing shoreline current in
d. Note how the spit curves toward Drakes Estero at its western end. What might this suggest about the strength of the incoming tide vis-à-vis the strength of the outgoing tide?
(The incoming tide is probably
stronger than the outgoing tide as indicated by the northward bend of Limantour
Spit. The curvature at the north end of
4. See the diagram of marine terraces. This diagram would
represent a view from the
5. The beaches at Point Reyes are long and narrow and the
sand dunes along the
Point Reyes National Seashore contains unique
elements of biological and historical interest in a spectacularly scenic
panorama of thunderous ocean breakers, open grasslands, bushy hillsides and
forested ridges. Native land mammals number about 37 species and marine mammals
augment this total by another dozen species. The biological diversity stems
from a favorable location in the middle of
5. Sagatuck ,
MI
1. a. What structure has been built at the mouth of the
b. What two
purposes does it serve? (stabilize the mouth of the
c. 1. Do the sand
deposits on either side of the structure indicate a prevailing current along
this section of the shoreline? (no)
2. Justify
your answer. (the deposits on either side of the jetty
are balanced which indicates a wind from a northerly component, mostly
northwest, being balanced with a wind with a southerly component, mostly
southwest.)
2. a. Note the little community of Oxbow in Sec. 4, T3N,
R16W. How do you think it got it's name? (old oxbow of
the
b. Draw an estimation of how the
3. a. How can you account for
b. Which
seems to have dominated in this area, the force of running water or the force
of the waves and wind building the beach and dunes? (the
waves and wind)
c. Explain your answer. (The dunes are quite large here which indicated a good supply
of sand that is brought in by the waves and built into dunes by the wind. The
fact that the Old Saugatuck Lighthouse is not at the mouth of the stream
indicates that the mouth of the stream must have been here at some time in the
past. If the jetty system were removed the mouth of the stream would likely
change from time to time with the coming and going of major storms, which most
often occur in November.)
6.
1. a. What was built at the mouth of
b. Note the
contrast between the two sides of the structure on this map as compared with
the balance on either side of the structure at Saugatuck. This map shows
prograding on the northern side and retrograding on the south side. What does
this suggest with respect to the direction of the prevailing winds and
shoreline current in this area? (The prograding on the
northern side and retrograding on the south side indicate a stronger current
from north to south than from south to north.)
c. 1. What was built into
2. Does it appear to have solved
the problem retrogrdation? (yes) What is the
basis for your answer? (The shoreline is quite balanced
on either side of the breakwater.)
2. Note the large concentration of railroad tracks at
Elberta. This was one of the west
3. a. What is the elevation difference between
b.
c. What would
happen if you tried to empty this much water through a narrow channel into
d. This is exactly what happened during the lumbering era. A
saw mill was located near the eastern end of
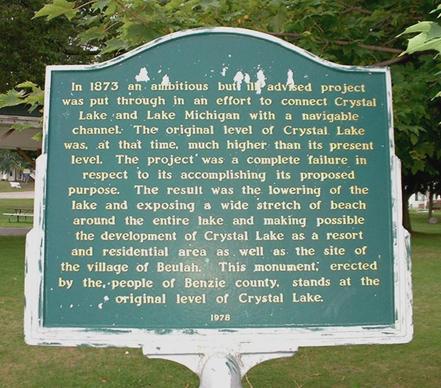
Fig. 1. At the public beach park in downtown Beulah.
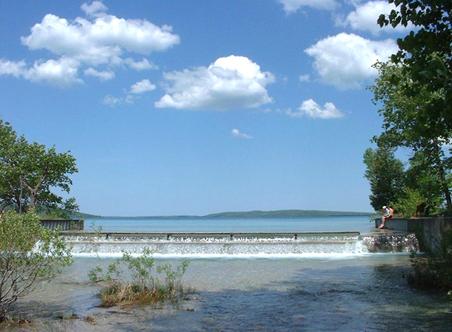
The Dam where Crystal Lake "ran out" in the tragedy of Crystal Lake, 1873.
4. a. Examine Platte River Point in the northeast portion of the map. What
direction of shoreline current is indicated by the point? (west to east)
b. Which seems to have the most energy at this point,
the waves of Lake Michigan or the waters of the
c.
Explain your answer. (The
d.
This map was made in 1983. If you visited the area today you might find the
Platte River Point as you see it on the map, but do not be surprised if it is
different because the point is a small and fragile feature that is moved by the
waves as they come from different directions as the winds shift.
7. Michigan City
West, IN Topographic Map and B & W copy of lakefront.
1. What has been installed at the mouth of Trail Creek? (jetty)
2. a. What is the structure called that is offshore with
lights at both ends? (breakwater)
b. What does it
break? (the energy of the waves approaching the
entrance to Trail Creek and the marina)
3. a. Note the offset of the shoreline on either side of
Trail Creek. What does this suggest about the direction of the prevailing
longshore current in this area? (the prograding
condition on the east side indicates a current from east to west)
b. The prograding condition to the east has built a wide smooth beach for the people to enjoy and protect the beach houses shown close to the shoreline near the eastern edge of the map.
c. The retrograding condition on the west side of Trail Creek has been due to shoreline erosion as the current moved westward after dumping its load of sand on the east side of Trail Creek. The power plant has protected its site with a steel wall on the lake side, but to the west at the end of the steel wall the erosion continues. Note the recession beyond the steel wall in Sec. 30. T38N, R4W.
d.
4. a. Measure the amount of offset from the
b. This is the most extreme situation that I know of on Lake Michigan which shows the negative consequences of shoreline "protective" devices, which map protect one area, but cause a negative impact downwind from the protected spot.